As an opinionated advocate who doesn’t always know when to keep his mouth shut, I sometimes find myself getting yelled at (usually online, where the yelling is merely implied, rather than inflicted on my eardrums) by those who have decided that my interest in compact, walkable communities is an existential threat to their way of life:
“You can’t expect everyone to ride bicycles, you know!”
“Some people like having their own house with a yard. We’re not just all going to give that up.”
“You want every one of us to sacrifice the lifestyle we moved here for to achieve your goal of radically transforming our city.”
As an urbanist who spends plenty of time in conversation with others who have a strong interest in walkable, compact communities, I also get to hear a lot of things like these:
“The suburbs are dead. The millennial generation doesn’t want to live in a cul-de-sac and have a three-car garage anymore, so those places are all going away.”
“Low-density neighborhoods are not sustainable. We need to add a lot more density, everywhere.”
Both of the above sets of perspectives are, in one way or another, detached from some basic mathematical realities.
Public debate about even minor changes to land-use policy often seems premised on the unstated assumption that the stakes are colossal. Sometimes, it can feel like we are being asked to either approve or reject a sweeping, wholesale redesign of our communities, which will no doubt be implemented by our city planner overlords with all the zeal of a Leninist Five-Year Plan. For example, the tentative proposal in Minneapolis’s new draft comprehensive plan to allow (not require) duplexes, triplexes, and fourplexes in single-family neighborhoods has been greeted with some stunningly breathless rhetoric about the “extinction” of single-family homes.
Extinction? Really? There are about 78,000 detached single-family homes in Minneapolis. To replace even half of them would mean more construction than has occurred in the entire city in the last four decades combined. And every one of those 39,000 single family homeowners would have to sell for that to occur. Most of those homes are going to be around for a long time yet.

And single family homes are likely to endure in most places. The median year that a residential structure was built in the U.S. is 1977. That was 41 years ago. Let’s assume the pace continues: that means we can predict that half of all the structures that will exist in 2059 already exist today.
I’m in my 30’s right now; I’ll be elderly in 2059. The world will, presumably, be a dramatically different place. Yet half of the built environment that’s going to exist then probably already exists right now. I can hop on my bike tomorrow and go look at it.
Whether you welcome urban transformation or fear it, it’s easy to overestimate how much things have already changed, and how much things are going to change in the near future. There are a lot of ways to measure the pace of transformation, but let’s look at a simple one: What’s the average percent of a region’s housing stock that has been built new in the past few years?
Census data allow us to answer this question. For the U.S. as a whole, the answer is 2.3%. About 3.1 million housing units, out of a total of 134 million nationwide, are estimated by the Census Bureau’s most recent American Community Survey to have been built between 2010 and 2016.
And remember, this isn’t all the type of overhaul that folks in Minneapolis are so afraid of. Because a lot of those 3 million new homes are in brand new subdivisions where there were no prior neighbors, or large apartment buildings at the edge of a neighborhood rather than in its interior. If you buy a single-family home in America, chances are you’re buying it in a location where far less than 2.3% of the housing stock is brand new, and the composition of the neighborhood is mostly exactly how its always been—dominated by other single family homes, and not changing particularly fast. But for the sake of argument, let’s go with that 2.3% figure and explore it.

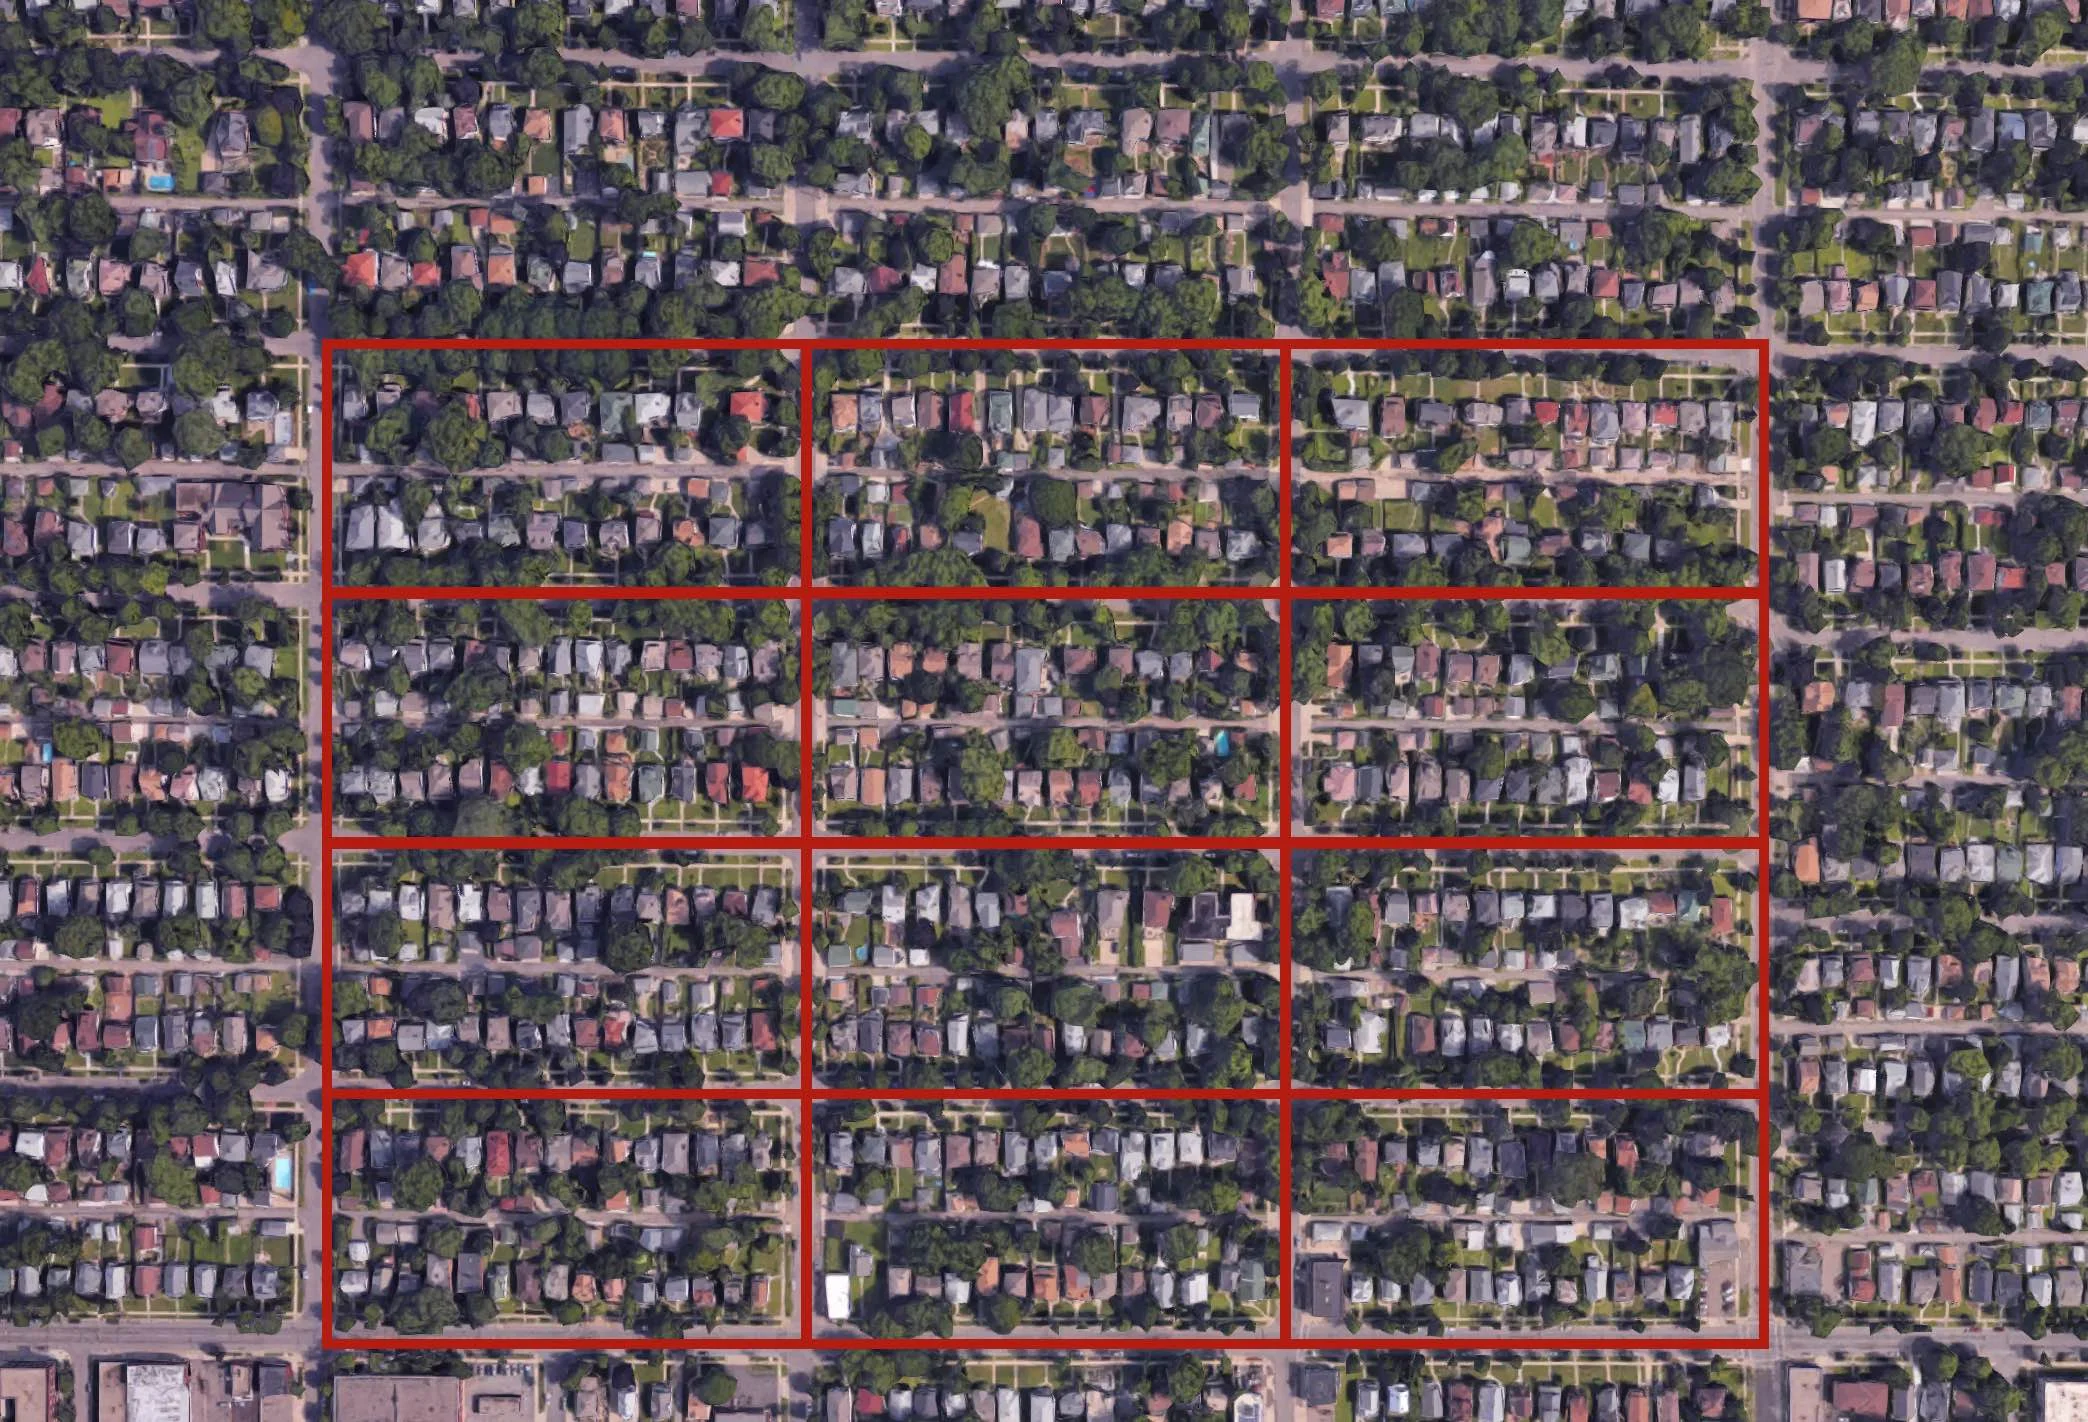
Before
Twelve typical (1/16 x 1/8 mile) gridded city blocks.


After
The median pace of neighborhood change is close to 1 in 48 homes built new every six years: it’s as if only the homes shaded dark red in this image were torn down and rebuilt in a six year period.
What does 2.3% growth in six years mean? Here’s an aerial photo of a few typical city blocks, 1/16 mile wide by 1/8 mile long, in a typical gridded urban neighborhood. There are 24 homes on each block.
Imagine that just one home every two blocks—one out of 48—is torn down and replaced every six years or so. Imagine that’s true across an entire neighborhood. That neighborhood is then changing at about the median rate. Roughly half of all U.S. neighborhoods have more new buildings than that. Half have fewer.
One out of 48 homes every six years: you could buy a house in that hypothetical neighborhood and live there for most of your adult life, and things when you moved out would look much like when you moved in. Countless Americans live in places where that is the case.
And not all that many of us do settle in a place for our whole adult lives anyway: the median length of homeownership is just 8.7 years. A common argument against neighborhood change is that those who purchased in a neighborhood were buying a particular character, density, and set of amenities that existed when they purchased, and they deserve to retain that. But if that’s your argument, it’s fair to say that, if most neighborhoods change very little in 8.7 years, or even twice that time, most people’s expectation isn’t actually being violated. In fact, most neighborhoods could see a whole lot more incremental change than they do, and the median homeowner would still get to move out of a neighborhood much like the one she moved into.
A striking and highly-publicized series of maps by Dr. Issi Romem at BuildZoom made this point back in February: the vast majority of developed America consists of areas where there is virtually no new construction. Within most metropolitan areas, there are only small pockets of more significant change. And this is true even in fast-growing places.

The fastest-growing major metropolitan area in the U.S. from 2010 to 2016 was Austin, Texas, which grew at about 3% per year over that period. Contrast that reality to the mind-boggling growth of Chicago in its early days: from a population of 30,000 to just over 1 million in the four decades from 1850 to 1890, an annual growth rate of over 9% per year.
The social and geographic conditions that produced that kind of population explosion don’t exist anymore. The frontier is long closed, and we’re not building entire new cities in the middle of nowhere anymore (well, mostly).
If you add up all the subdivisions that have sprung up on former cornfields or ranches in the past four decades, there are places where you certainly find growth as dramatic as that of mid 19th century Chicago. But that growth is distributed across the country—there are no whole metropolitan regions growing that way anymore, and there aren’t likely to be again.
Concentrated Neighborhood Change: Seattle as Case Study
A reasonable objection to these observations is that change isn’t evenly distributed throughout metro areas. When people are wary of opening the door to neighborhood change (by, for example, relaxing zoning rules to allow it), their core fear is, presumably, that their specific neighborhood will be subject to cataclysmically disruptive change, even if their whole city is not.
(Nonetheless, rhetoric suggesting that such cataclysmic change will sweep an entire city or region is not uncommon—the aforementioned “extinction” of single-family homes, for example, or the suggestion that an entire city will gentrify. That rhetoric is, to reiterate, completely divorced from mathematical reality.)
How common is it for a neighborhood to experience a disruptive amount of new development? We can analyze this too, using census tracts as a proxy for neighborhoods. A census tract is, on average, about 4,000 people, and roughly corresponds to a neighborhood in scale.
King County, Washington is a good test case: it’s a very large county (over 2 million inhabitants) which includes within its boundaries a major city, a large suburban area, and a large rural area. That city, Seattle, has been growing at breakneck speed.

What does that look like on the ground in terms of physical neighborhood change? Well, it depends very much on where you live. In the median census tract in King County, an estimated 1.8% of the housing units are located in buildings built since 2010. If you bought your house in this median neighborhood at the beginning of 2010, about 98 out of every 100 homes that are there now were there before you moved in.
But what about a high-growth neighborhood? If we rank all census tracts in King County, the 90th percentile tract had 7.3% of its housing units built this decade. That 90th percentile tract happens to be in the suburb of Shoreline on the county’s northern border with Edmonds. A quick Google Maps visit made it abundantly clear to me what the story is there:

Remember, that 7.3% figure is of housing units, not buildings. Each apartment in that large new apartment building counts as much as a detached home with a yard. If you drop your Street View cursor on a nearby residential side street, you find a peaceful neighborhood that looks like it must have looked for decades:

Remember: this is a neighborhood that is changing more rapidly (by this measure) than 90% of other neighborhoods in the core county of one of the fastest-growing regions of the United States.
In King County’s two fastest-changing census tracts (and only in those two), over 20% of all residential units have been built since 2010. These correspond to two adjacent neighborhoods: Lower Queen Anne and South Lake Union. The latter is the site of Amazon’s world headquarters. The area looks like this:


Lots of big new buildings. Active construction sites. Plenty to disrupt day-to-day life. And, well, Amazon—so there you have it: the exception that proves the rule. Extremely rapid neighborhood change is usually associated with extremely unusual circumstances, such as an employer in the neighborhood that just so happens to be the world’s largest online retail company.
Disruptive growth in U.S. cities is overwhelmingly concentrated in a very small handful of neighborhoods, and they fall into two types: fringe “greenfield” (i.e. formerly rural or undeveloped) areas, and urban infill neighborhoods with unusual characteristics that have caused the market to take off in a very localized area.
What Does It All Mean?
Whether this is good or bad news depends a lot on your frame of reference. If you’re a fan of dense urban neighborhoods and rooting for the wholesale abandonment of the suburbs—or at least their mass redevelopment into something vibrant, walkable and eco-friendly—you’re likely to be disappointed. The momentum is not there. The people are not there. America is full of places whose population would have to grow tenfold to achieve the kind of urban density where high-quality transit, for example, is viable. Simple math dictates that few of them will do that. Odds are, half of the buildings that will exist in 2059 are already with us.
If you’re a homeowner in a “no-build” (or almost-never-build) neighborhood, and stability is something you prize, it might be a pretty good deal for you. It’s not nearly so clear, though, that it’s a good deal for our cities and towns.
Funneling neighborhood change to a small number of locations magnifies its impacts in that handful of locations. Sometimes this takes the form of gentrification, in the many senses of that controversial word. It can also be a powerful inducement to land speculation, particularly when the actions of local governments serve (intentionally or unintentionally) to manipulate and distort land prices.
Our zoning codes and other building regulations serve to freeze most other neighborhoods in suspended animation, which prevents market signals from functioning. This comes at a cost to the economic resilience of our cities.
To be clear: by “market signals,” I don’t mean the whims of developers. I mean the process by which people vote with their feet and move to places they want to be. This process requires that successful places be able to make room for new arrivals, and that unsuccessful places receive the feedback—in the form of people leaving and revenues dwindling—that they need to adapt and evolve. When they can’t, all of our cities become less prosperous and productive, and their inhabitants’ individual needs and aspirations are less well served.
It also has profound implications for two things we care a lot about at Strong Towns: financial sustainability and resilience. We’ve built far too much infrastructure in this country. And much of it is not being used to anywhere near capacity. The rational response to this predicament is to stop expanding outward, and to free up millions of individuals to make the millions of small investments that will make better use of the places—buildings, roads, pipes, and so forth—that we’ve already got, and which we’re mostly stuck with.
The good news for someone who cares about that goal is this: it’s clear that the vast majority of places could tolerate a whole lot more incremental change without betraying the residents who liked it just the way it was when they moved in.